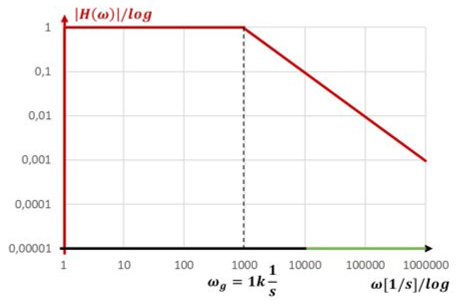
To determine an output signal, the input signal of the filter is multiplied by the transfer function H. Its peak value changes by |H(ω)|. The phase of the input signal is rotated. The filter acts differently on useful and interference signals if they have different frequencies. Let us look at an example filter:
The Bode plot and the formula characterise the filter. Now let us look at some input signals. In each case we specify their frequency and look at how the filter characterised above changes their peak value. The voltages u1 and u2 have been chosen arbitrarily for the examples:
\[
\begin{gathered}
\text{Peak value of the input voltage } u_1\text{:} \\[6pt]
u_{1,\mathrm{Ein}}(t) = 1\,\mathrm{V} \cdot \sin(\omega_1 t) \text{ with } \omega_1 = \mathbf{10}\,\frac{1}{\mathrm{s}},\ \varphi_1 = 0 \\[6pt]
\text{Filter effect:} \\[6pt]
\omega_1 < \omega_g \rightarrow \text{range 1:} \\[6pt]
\text{Read from the Bode plot: } |H(\omega_1)| = \left|H\left(\mathbf{10}\,\frac{1}{\mathrm{s}}\right)\right| = 1 \\[6pt]
\text{Output signal: } \hat{u}_{1,\mathrm{Aus}} = H(\omega_1) \cdot \hat{u}_{1,\mathrm{Ein}} = \hat{u}_{1,\mathrm{Ein}} \\[6pt]
\text{The signal passes through the filter unchanged}
\end{gathered}
\]
Of the second voltage, we see almost nothing behind the filter. The first voltage is not changed by the filter. If the second voltage was an interference signal, we have done everything right.